Resiliency: two alternatives for fault tolerance to
deprecated Hystrix
What is fault tolerance?
A fault-tolerant design enables a system to continue its intended operation,
possibly at a reduced level, rather than failing completely, when some part
of the system fails. It is the ability of maintaining functionality when
portions of a system break down is referred to as graceful degradation.
Dealing with unexpected failures is one of the hardest problems to solve,
especially in a distributed system. Resiliency is the ability to recover
from failures and continue to function. The goal of resiliency is to return
the application to a fully functioning state after a failure. Circuitbreaker
is the primary design pattern that is followed to solve this problem.
A quick look on what we get
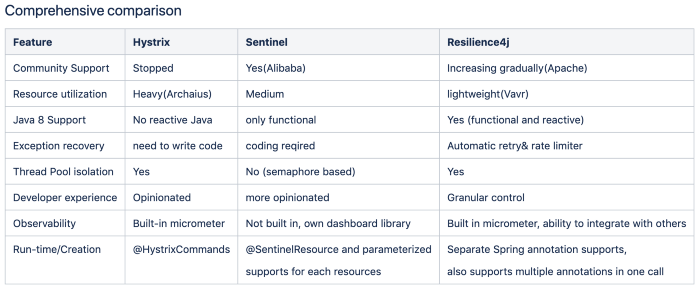
Comparison of 3 popular libraries: Hystrix, Sentinel and Resilience4j
Is your system fault tolerant?
Hystrix
Hystrix is (was) a very popular fault tolerance library for server side
engineering. It handles resiliency effective in the micro services world
that developed and maintained by Netflix. However, it is now in maintenance
mode and no one is going to release any updates as of today. Interested
community members are requested to reach out hystrixoss@googlegroups.com
take ownership of Hystrix for moving back into active mode.
However, that gave everyone in the community to explore other available
libraries that are being maintained and have a strong back. I happen to
study and evaluate a couple of other options viz Sentinel and Resilience4j
and going to compare them comprehensively so that the community get
benefited by taking faster decision on their choices.
Circuit-breaker
Let’s quickly look at the Circuitbreaker pattern and how Hystrix implements
it. The circuit (an object) has three states in operation.
- Closed — Allow the remote Connection through
- Open — Break the remote connection
- Half-open — Allow Limited Number of connection to Test (aka
Limited Closed)
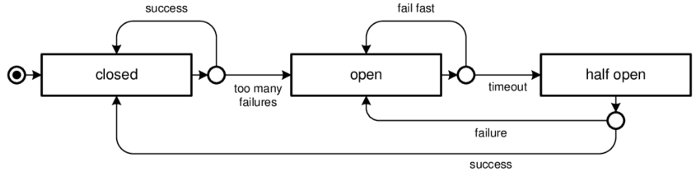
A Circuit breaker pattern: States transition
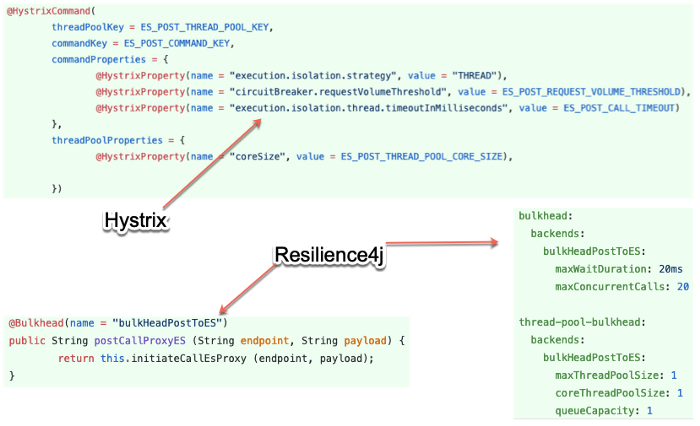
Hystrix calls to the external world has to be wrapped with HystrixCommand
annotation. It do supports spring-boot annotation. As follows ->
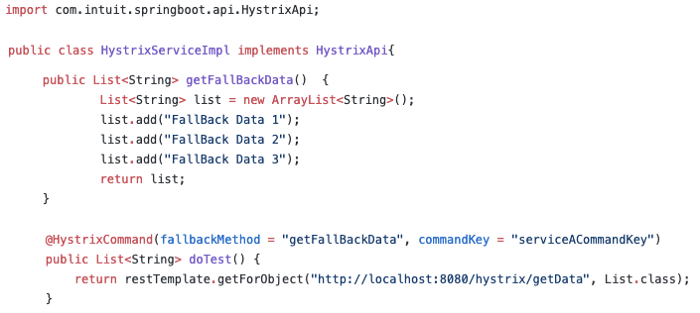
Hystrix Implementation on Spring boot 2
After that, all are based on the command aspect or in that context with code
and configurations. Resilience4j, in contrast provides higher-order
functions (decorators) to enhance any functional interface, lambda
expression or method reference with a Circuit Breaker, Rate Limiter or
Bulkhead. Furthermore, the library provides decorators to retry failed calls
or cache call results. That means, we can combine a Bulkhead, RateLimiter
and Retry decorator with a CircuitBreaker decorator. The advantage is that
we have the choice to select the decorator.
Hystrix and other two libraries emit a stream of events that are useful to
system operators to monitor metrics about execution outcomes and latency.
Semantically, Hystrix has configurations in the code therefore is it tightly
coupled with the HystrixCommand callback.
Side by Side: Resilience4j provides Yaml based configurations
One interesting difference in resilience4j is ability to add multiple fault
tolerance features into one call as below. At the end of the day it is more
configurable and amount of code needs to be written is less with right
amount of abstractions.
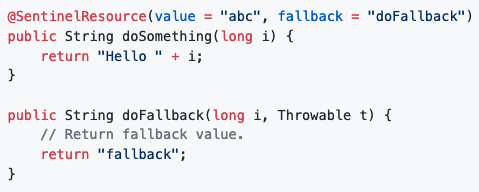
@CircuitBreaker(name = BACKEND, fallbackMethod = "fallback")
@RateLimiter(name = BACKEND)
@Bulkhead(name = BACKEND)
@Retry(name = BACKEND, fallbackMethod = "fallback")
@TimeLimiter(name = BACKEND)
Public String postCallProxyES(...) {
... . ..
}
The default Resilience4j Aspects order is the following:
Retry ( CircuitBreaker ( RateLimiter ( TimeLimiter ( Bulkhead (
Function ) ) ) ) )
If we need a different order then we can use the functional chaining style
instead of the spring annotations style.
Sentinel vs Resilience4j
Spring-boot 2: Sentinel from Alibaba
Sentinel has the same syntax too. The primary difference with Resilience4j is
the granularity of control and ability to be integrated with other live
monitoring systems. Therefore I would prefer Resilience4j over it.
Sentinel has its own dashboard module. It assumes it will run in a
distributed multi clustered environment always, therefore it comes with a
baggage of dependencies no matter we need it or not.
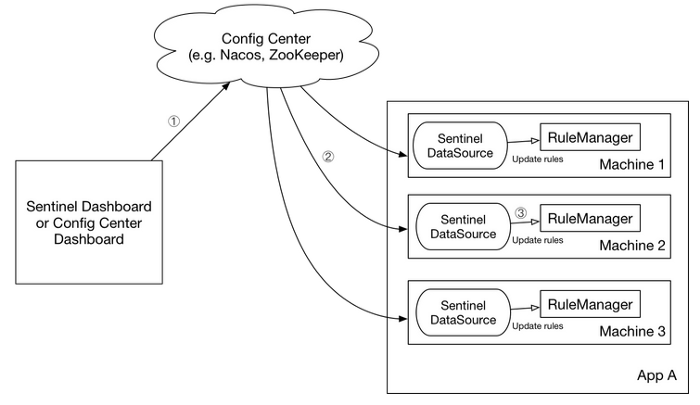
Observability tool: Sentinel dashboard module
Functional java example
Supplier decoratedSupplier = CircuitBreaker
.decorateSupplier(circuitBreaker,
backendService::doSomething);
String result = Try.ofSupplier(decoratedSupplier)
.recover(throwable -> "Hello from Recovery").get();
//Execute the decorator
String result = circuitBreaker
.executeSupplier(backendService::doSomething);
Reactive java example
@Bean
public CircuitBreaker ipServiceCircuitBreaker() {
CircuitBreakerConfig
config = CircuitBreakerConfig.custom()
.waitDurationInOpenState(Duration.ofMinutes(5))
.ringBufferSizeInClosedState(100)
.ringBufferSizeInHalfOpenState(30)
.failureRateThreshold(10)
.build();
return
CircuitBreaker.of("ipService", config);
}
Core modules
Core modules:
- resilience4j-circuitbreaker: Circuit breaking
- resilience4j-ratelimiter: Rate limiting
- resilience4j-bulkhead: Bulkheading
- resilience4j-retry: Automatic retrying (sync and async)
- resilience4j-cache: Result caching
- resilience4j-timelimiter: Timeout handling
Hystrix is a more matured product and proven through time. Compared to
Sentinel, Resilience4j is new however, looks more promising as it tries to
culminate some of the goodnesses from both of them.
Resiliency for nodeJS apps
Good news is that HystrixJS is not managed by Netflix. It is one of the very
popular npm modules among nodeJS developers. It uses RxJS.
	var hystrixConfig = require('hystrixjs').hystrixConfig;
	if (localEnv) {
	hystrixConfig.init({
	"hystrix.circuit.volumeThreshold.forceOverride": true,
	"hystrix.circuit.volumeThreshold.override": 0
	});}
The library provides a module HystrixSSEStream to export gathered metrics as
a server side events stream.
var hystrixSSEStream = require('hystrixjs').hystrixSSEStream;
function hystrixStreamResponse(request, response) {
return hystrixSSEStream.toObservable().subscribe(
function onNext(sseData) {
response.write('data: ' + sseData + '\n\n');
},
function onError(error) {
console.log(error);
},
function onComplete() {
return response.end();
});};
Observability with Resilience4j
Well, there is a plethora of choices to exactly log and see what is happening
to the integration. It took me two days to decide on what my team should
learn and use.
Resilience4j provides in-built micrometer-core (unlike hystrix added the
whole of the library with many dependencies) support with a bunch of
useful metrics in it such as State of the circuit, slow call rates,
failed rates, retry matrices etc. [https://resilience4j.readme.io/docs/micrometer]
MeterRegistry meterRegistry = new SimpleMeterRegistry();
CircuitBreakerRegistry circuitBreakerRegistry =
  CircuitBreakerRegistry.ofDefaults();
CircuitBreaker foo = circuitBreakerRegistry
  .circuitBreaker("backendA");
CircuitBreaker boo = circuitBreakerRegistry
  .circuitBreaker("backendB");

TaggedCircuitBreakerMetrics
  .ofCircuitBreakerRegistry(circuitBreakerRegistry)
  .bindTo(meterRegistry)
That’s it! This will register all available metrics to Micrometer event
registry.
However, there is no way we could view those metrics without doing
anything.
Couple of easy approaches are mentioned as below — in-order to view those
exported metrics.
Pull based metric
Micrometer -> Prometheus -> Grafana
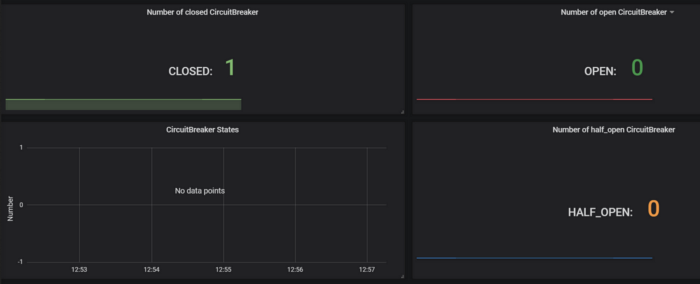
The States of the circuit breaker: Micrometer->Prometheus->Grafana
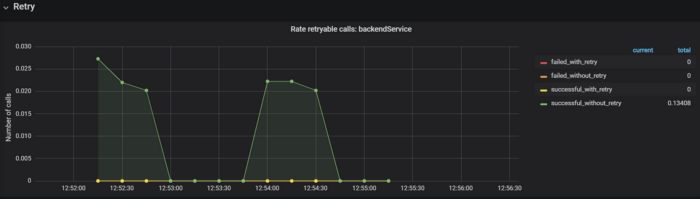
Retry metric for an external service: Prometheus endpoint consumed by
Grafana server.
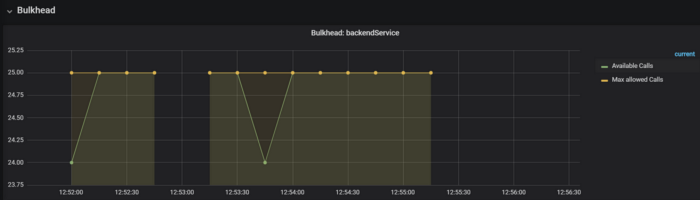
Elastic Search endpoint is protected by Resilience4j.Bulkhead
In this case, micrometer.io (spring-boot) library creates logs based on
configurable metrics. There are a couple of ways that can expose this data
out from the application server. One idea is to run an agent like Splunk or
AppDynamics like a side application and push the data to their respective
logging services.
Event-based metric
Micrometer -> Vert.x -> telegraph -> wavefront
Below example the circuit breaker events are captured by micrometer and
formatted by Prometheus.
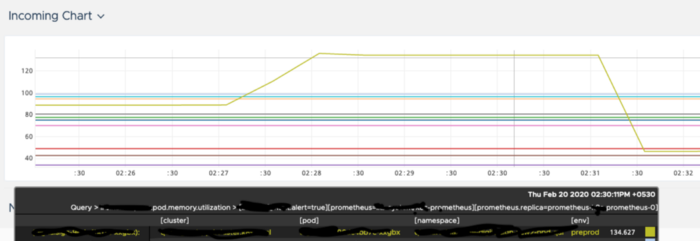
Wavefront dashboard: Resilience4j.bulkhead [and External call to an
Elastic search is caped at a point]
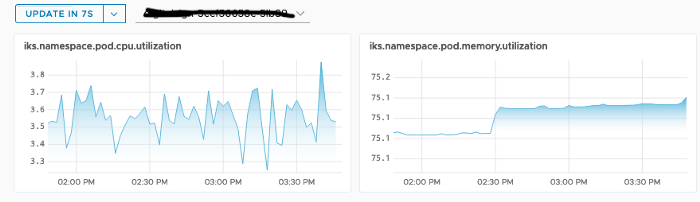
Wavefront in Kubernetes: overall utilization